valaxy博客全局美化教程(一)
本系列教程共十篇
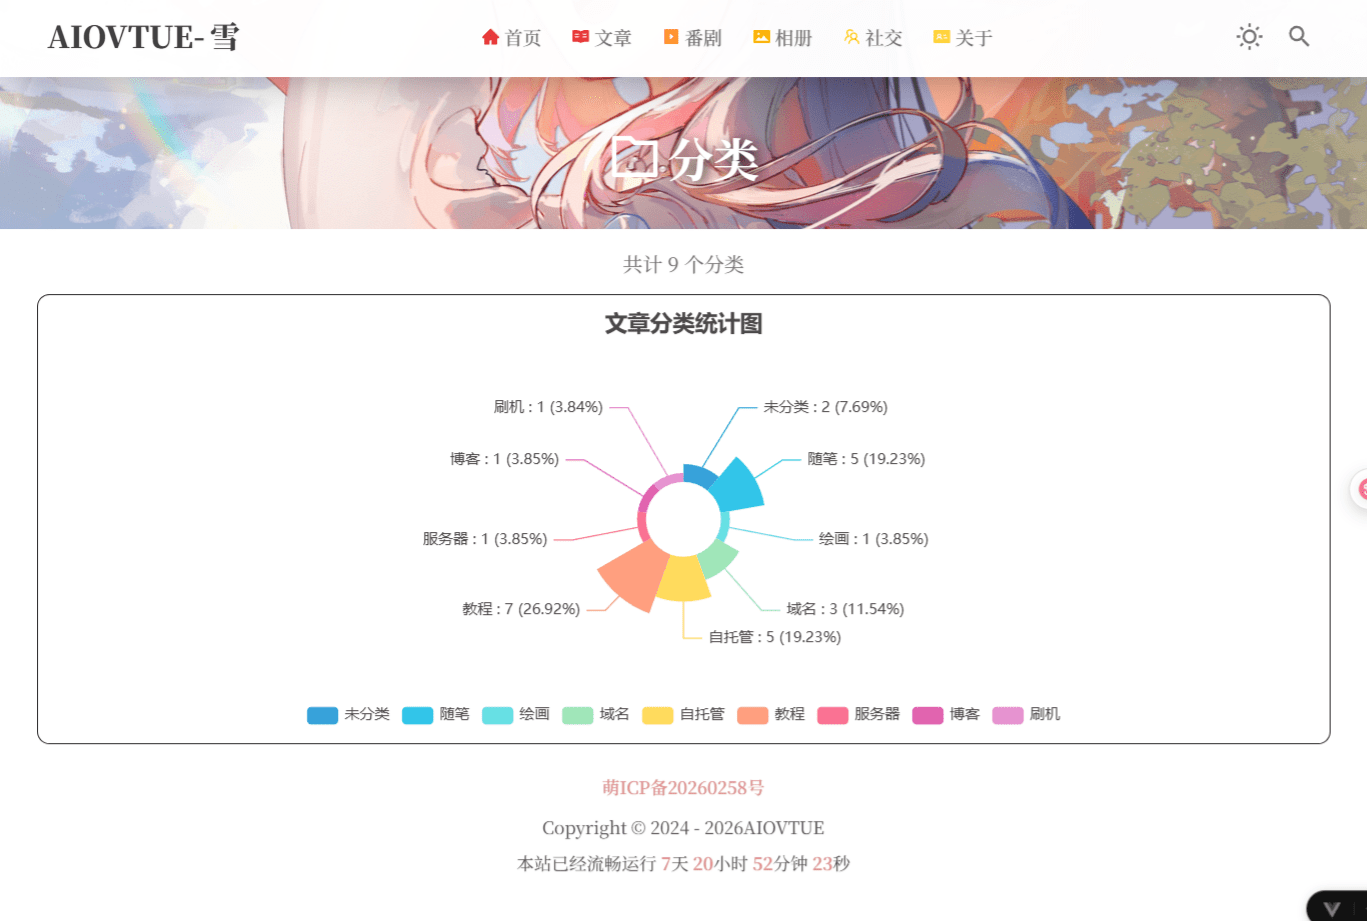
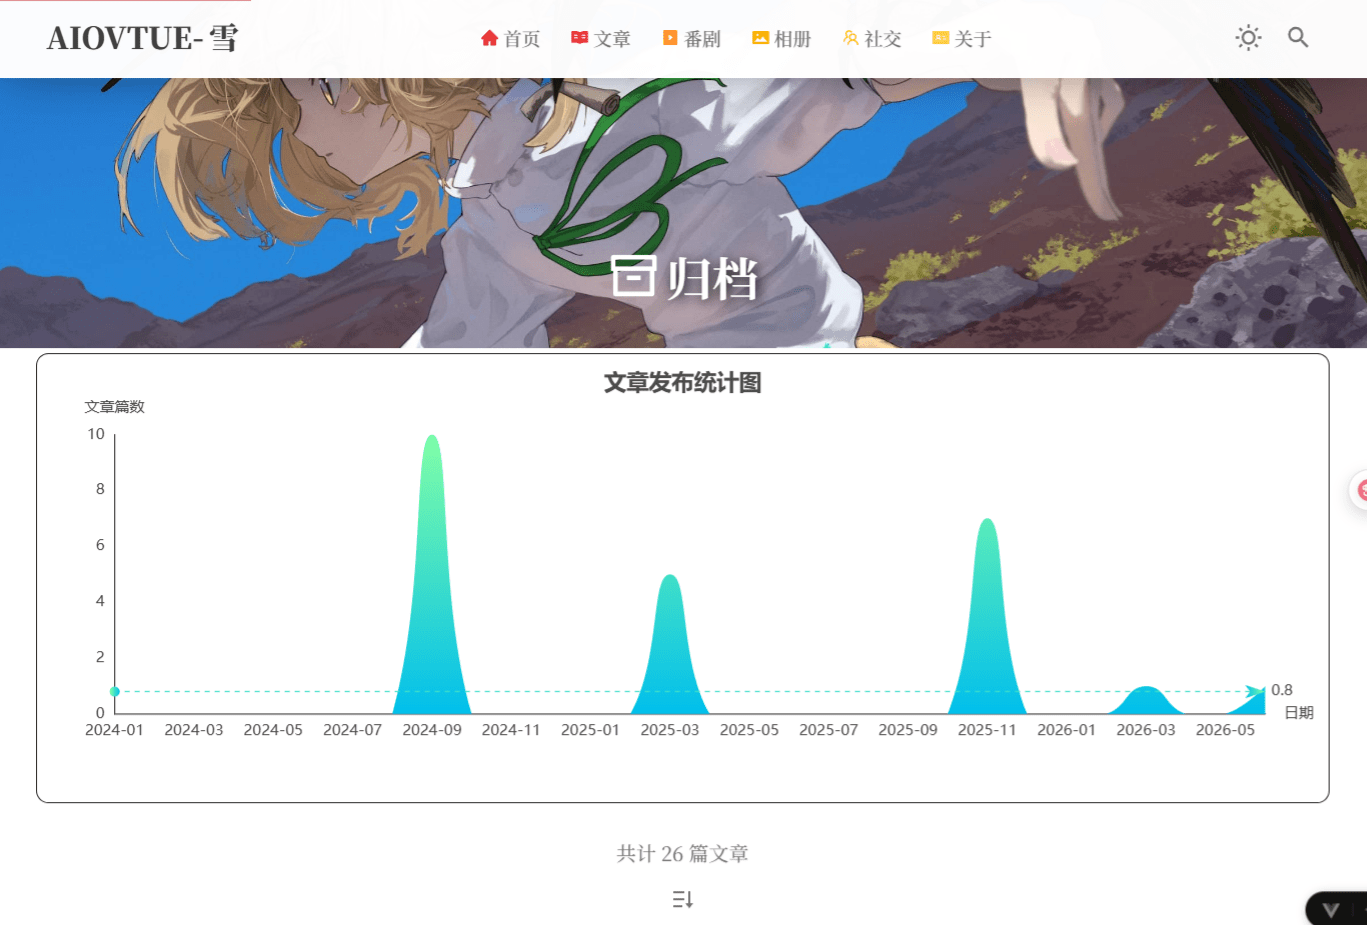
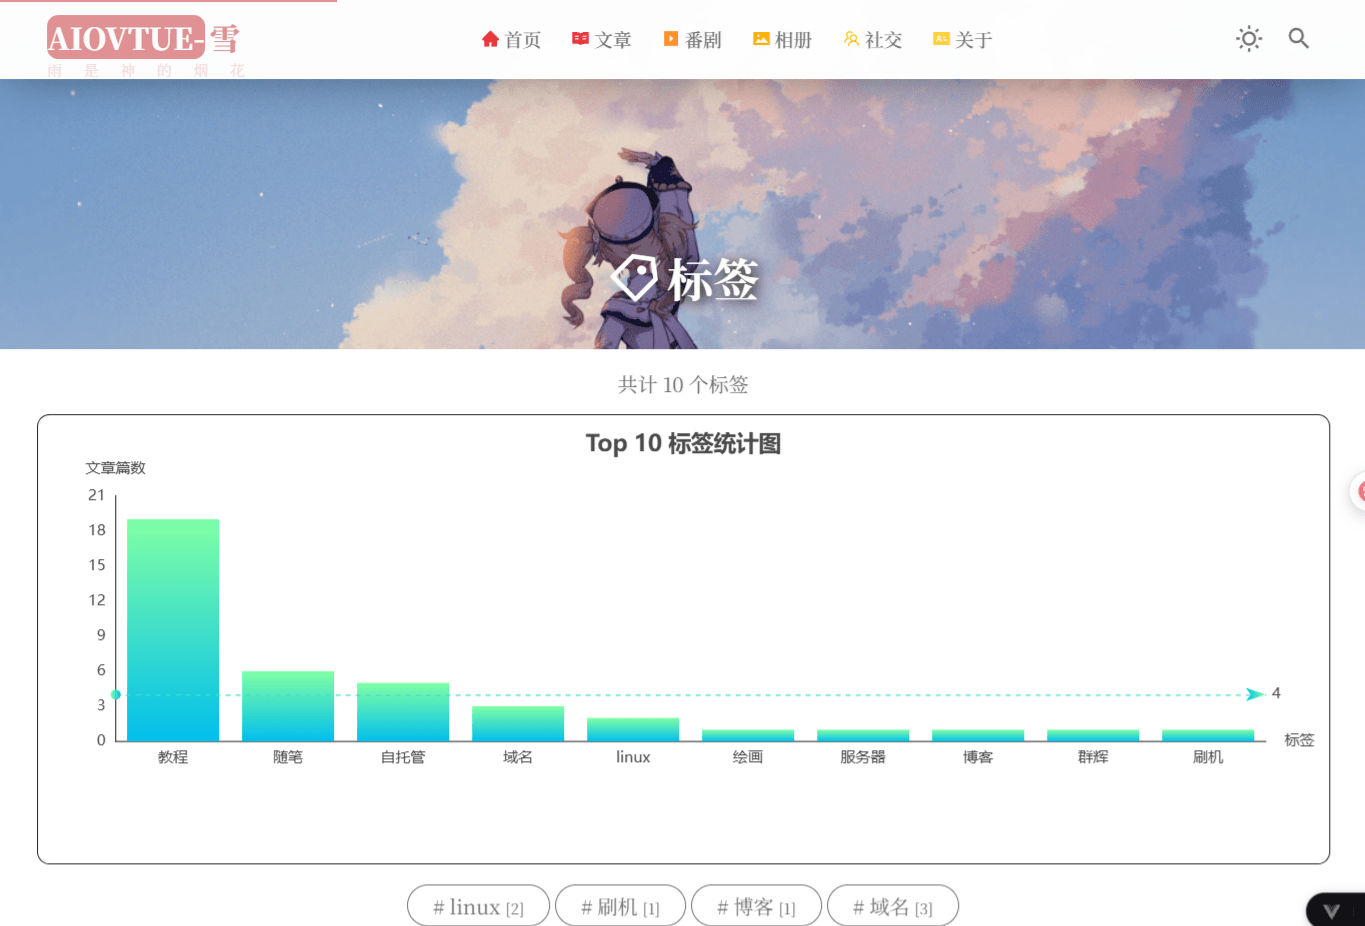
- valaxy博客全局美化教程(一):分类、标签、归档三个页面的美化教程
- valaxy博客全局美化教程(二):首页公告栏美化,新增随机文章展示板块
- valaxy博客全局美化教程(三):给网页增加加载动画
- valaxy博客全局美化教程(四):增加图片预览功能
- valaxy博客全局美化教程(五):友链页面美化,修改了友链样式以及增加留言板
- valaxy博客全局美化教程(六):留言页面增加信封展开效果
- valaxy博客全局美化教程(七):新增网址导航页面
- valaxy博客全局美化教程(八):页脚倒计时、搜索问题修复
- valaxy博客全局美化教程(九):新增相册页面,支持使用webdav作为相册
- valaxy博客全局美化教程(十):修复构建结束的时候会卡住
最初部署
简介
简单介绍一下valaxy,Valaxy = V + Galaxy 旨在成为下一代静态博客框架,提供更好的热更新与用户加载体验、更强大更便捷的自定义开发可能性。附上开源地址valaxy
本系列教程使用的主题是Sakura主题,附上开源地址sakura
在开始教程之前先看一下最终的页面效果先:
开始部署
本教程基于windows端
-
选择一个合适的地方新建一个文件夹。
由于后期这个文件夹会变得非常大,所以建议一开始就选择合适的位置,推荐路径不要出现中文,虽然我弄下来没啥问题。
-
使用管理员身份打开powershell终端
虽然官方文档没要求必须管理员运行,但是我拉取文件的时候遇到一些问题,所有还是建议用一下。
-
在终端cd到你的文件夹
以防你不懂,加入你刚刚创建的文件夹路径是这个
C:\demo\demo,那么你只需要输入cd加上你的文件夹路径即可,示例:cd C:\demo\demo。 -
安装valaxy和主题
该操作基于电脑安装了
pnpm或npm的基础上,没安装的搜一下教程,或者看这个pnpm安装教程(主播也是百度找的~)
推荐安装pnpm,因为我用的这个,你们使用另一个的话后面可能会出一些奇奇怪怪的问题,毕竟我没用过
在刚刚的终端运行以下命令pnpm create valaxy,运行之后程序会开始创建流程
会经理一下过程
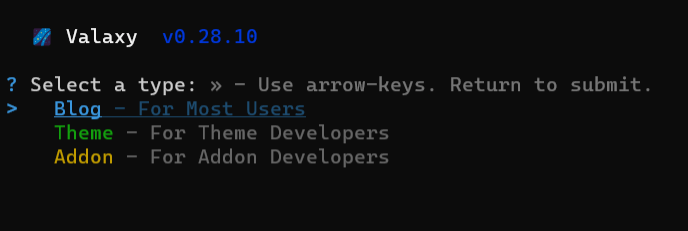
这个界面是问你用来干什么,选择第一个blog作为博客
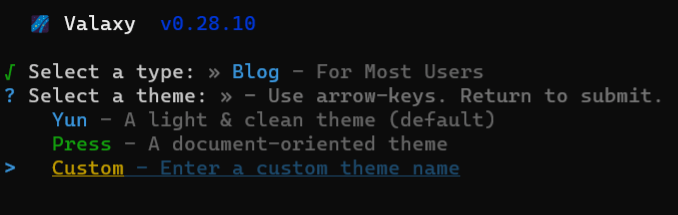
这是让你选择主题,我们选第三行custom,这行的意思是自己输入主题名
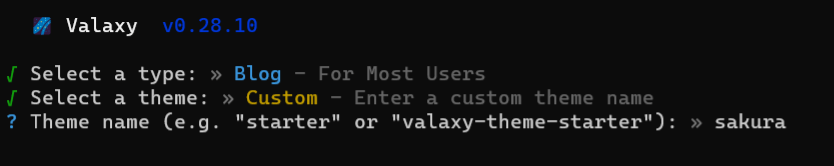
输入主题名sakura,本教程所有修改基于此主题,虽然没改主题文件,但是选其他主题可能会遇到奇奇怪怪的问题
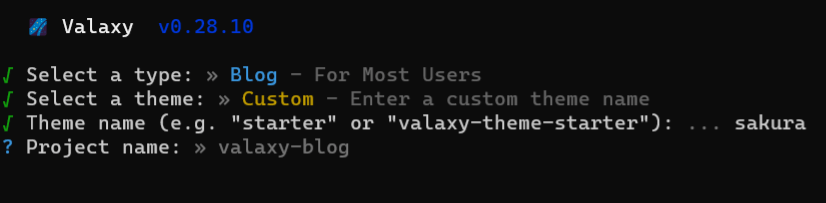
这是问你项目名称叫什么,就是文件夹名称,随便起一个英文就行
然后会问你是否运行,输入y就行
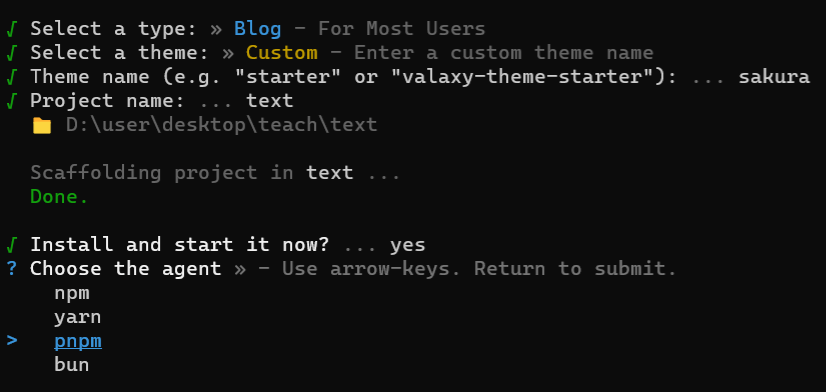
这里选择pnpm即可开始自动安装
出现下面的界面就是安装完成了
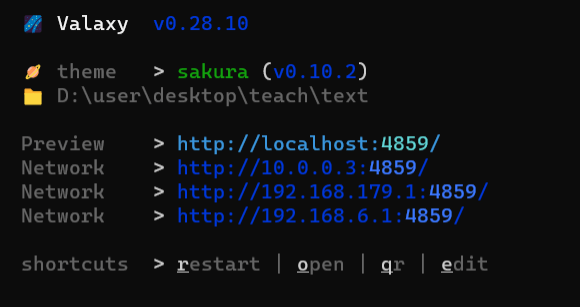
上面的链接就是你的网站,ctrl+鼠标点击即可在浏览器打开链接,到此可以初步预览你的博客
开始美化
一共分为两大步,其中要增加六个文件,修改三个文件,由于大部分教程重复,只拿第一次出现的地方进行说明,后面忘记了回来看前面
分类页面
分类页面公新增两个文件,别漏了哦
新增文件
所谓新增文件的意思就是新增文件夹,哈哈哈,这里解释一下我的写法是什么意思,博客的目录类似于
1 | 项目根目录/ |
这个就是你刚才创建的文件夹,拉取valaxy博客之后的文件夹目录,我写的路径是基于此根目录的,举个例子,下方的\components\SakuraCategoriesChart.vue文件的意思就是,在文件夹components内部,新建一个名为SakuraCategoriesChart.vue的文件(windows创建这种文件的办法是右键,新建文本文档,然后把文件名连同后缀更改为这个即可),接着将文件下方的代码<script lang="ts" setup> .........复制到文件内即可,后续类似的新建文件按照同样的步骤,根据上方的文件夹路径和文件夹名称创建文件在写入内容即可。
新增\components\SakuraCategoriesChart.vue
1 | <script lang="ts" setup> |
这里就是第二个文件啦,我就赘述了,要看清楚路径哦~
新增components\layouts\SakuraCategoriesLayout.vue
归档页面
现在开始是归档页面新增文件,这部分新增文件2个,别漏了哦
新增文件
新增components\SakuraArchivesChart.vue
1 | <script lang="ts" setup> |
这是第二个哦~
新增components\layouts\SakuraArchivesLayout.vue
1 | <script lang="ts" setup> |
标签页面
现在开始标签页面新增文件,该部分新增文件2个,别漏了哦~
新增文件
新增 components\SakuraTagsChart.vue
1 | <script lang="ts" setup> |
新增components\layouts\SakuraTagsLayout.vue
好啦,所有的新增文件部分都已经结束了,但是目前效果还没启动,我们还需要改一下配置文件进行引入才行,接下来跟我一起来操作。
其他文件
这部分文件和上面的不一样哦,也是新增文件,操作和上面还是一样的,该部分一共新增2个文件,加油吧
utils\echarts.ts
1 | import type { ECharts } from 'echarts' |
这是下一个文件
styles\index.scss
1 | /* 统计图容器:与文章卡片一致的背景与黑色描边,横向铺满视口并保留边距 */ |
修改文件
注意哦,这部分的文件不是新建,是在已有基础上修改,这种部分是需要从已有文件进行增加或删除部分代码,因为只占文件的一小部分,所以不适合整个复制
这里解释一下下方写法的意思,当我注明是修改文件时,或者你们根据路径找过去,发现已经有一个同名文件,就说明这是修改类型,下方的文件名和上方的一样,都是路径加文件名的格式,
最常见的文件修改就是valaxy.config.ts,因为这是配置文件,大部分修改都要在里面操作,简单介绍一下这个文件的部分
这是初始状态的文件:
1 | // import type { UserThemeConfig } from 'valaxy-theme-sakura' |
这部分import { defineValaxyConfig } from 'valaxy'是引入部分,后续也会涉及一些引入,跟这一行代码一样,在这一行下方粘贴对应代码即可,例如,当需要新增代码import { demo} from 'demo'代码时,效果就如下方这样:
1 | import { defineValaxyConfig } from 'valaxy' |
是不是很简单,还有一部分就是themeConfig: {},部分,这部分是主题配置部分,我一般给出的代码格式都是对好的,从下一行的第一个字符直接粘贴即可,这里下面就是一个很好的例子
这里直接写valaxy.config.ts没写路径,不是忘记写了,是此文件在根目录下,打开此文件进行修改,这里我给出的是增加部分代码,有时候我也会连着themeConfig: {},一起给,注意区份哦,我一般会说明的,这里复制下列代码,将其粘贴在themeConfig: {},的{}里面即可。
valaxy.config.ts的themeConfig内增加以下代码
1 |
|
下面的代码是加上themeConfig: {},的效果,///...这样的类似符号表示省略代码,因为这部分可以写很多东西,所以加在哪里都行,不过注意格式。
最终效果:
1 | themeConfig: { |
到此所有的修改就都完成了,如果你的终端服务还启动着,直接输入r即可刷新,再次前往浏览器就能看到样式了,如果终端关掉了,cd到项目目录,运行pnpm dev即可开启网页服务。
提一句
页面,就是分类页,归档页那些,不是一开始就有的,需要自己创建,具体位置在pages文件夹内,例如,我要创建一个分类页面,就在pages文件夹内部新建一个名为categories的文件夹(其实文件夹叫什么都可以,英文即可),如何在categories文件夹内部新建一个index.md文件,在文件内写上:
1 |
|
解释一下,layout: categories这个决定了你这是什么页面,这一行代表的就是分类页面,title就是页面标题,icon: i-ri-folder-line这个是图标,cover: https://你的图床.png这个是该页面顶部的头图,comment: false这个是是否开启评论(这个需要另外配置)
这里给出三个页面的index.md文件的内容,上面那个就是分类页面的
下面是标签页面:
1 |
|
归档页面:
1 |
|
其他本篇教程不涉及的页面可以看sakura主题文档
好啦,第一篇到此结束咯有用的话打个call吧